September municipal bond issuance rose slightly year-over-year, becoming the first month of 2023 to see supply increase from 2022 levels, as several billion-dollar deals were priced and a general market acceptance of the Fed’s ‘higher for longer’ stance took hold.
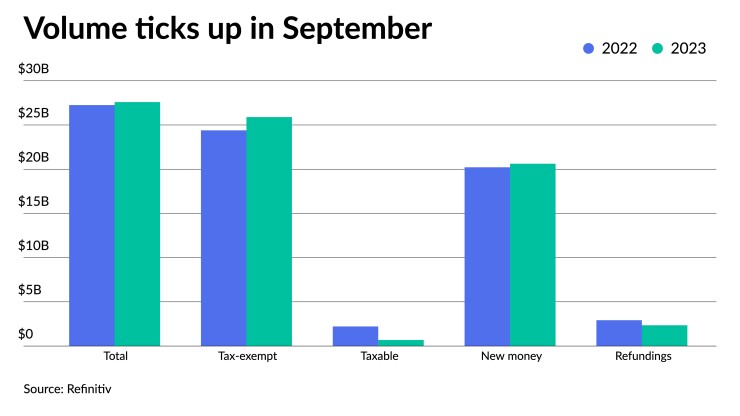
Led by tax-exempt, new-money deals, September’s total volume ticked up 1.2% to $27.585 billion in 531 issues from $27.251 billion in 592 issues a year earlier. However, issuance for the month is lower than the $30.652 billion 10-year average, according to Refinitiv data.
Tax-exempt issuance rose 6.1% to $25.891 billion in 490 issues from $24.391 billion in 523 issues in 2022. Taxable issuance totaled $685.7 million in 30 issues, down 69.1% from $2.219 billion in 60 issues a year ago. Alternative-minimum tax issuance rose to $1.009 billion, up 57.5% from $640.5 million.
New-money issuance rose 2% to $20.616 billion from $20.215 billion a year prior. Refunding volume fell 19.6% to $2.350 billion from $2.924 billion in 2022.
Supply was helped throughout the month by a slew of large deals, including $2.582 billion of various purpose GOs from California, $1.086 billion of consolidated bonds for the Port Authority of New York and New Jersey and $1.016 billion of state water implementation revenue fund bonds from the Texas Water Development Board.
However, some of these large deals helped disguise the uneven distribution of supply, sources said.
“Generally the first half of September — even though September tends to be seasonally a very heavy month for state and local government issuance — tends to be slower,” said Matthew Gastall, head of WM Municipal Research at Morgan Stanley. The back end of the month tends to be the busier weeks as investor interest picks up after participants comes back from the summer, he said.
This was somewhat true this September.
Only 103 issues came to market through Sept. 8, the lowest weekly total for the month. However, issuance for that period was the highest principal amount at $8.928 billion, helped by the billion-dollar-plus deals from California and the Port Authority of New York and New Jersey that priced Sept. 7.
Issuance during the third week of the month had the lowest principal amount at $5.192 billion as deals were either pushed back or pulled forward so as not to coincide with the Federal Open Market Committee meeting. Issuance for the second and final week of the month was at $7.219 billion and $6.272 billion, respectively.
Pat Luby, a CreditSights strategist, attributes the slight uptick in supply to new-money issuance, which accounted for 74.4% of all volume in September.
“There are projects that need to get financed, and issuers have to walk a fine line between increased cost of borrowing,” he said. “And if they wait to finance their new-money projects, then inflation is going to raise the cost of doing whatever it is that they’re looking to do.”
Furthermore, he said some issuers may have hopped to delay borrowing but with the market pricing that the Fed will hold rates ‘higher for longer’ and push out rate cuts, “delaying financing for a new-money project introduces more uncertainty than moving now.”
Some issuers, Gastall said, have started to accept the Fed’s ‘higher for longer stance’ and started to work with what could be the new normal.
“It was particularly after Jackson Hole in August that the markets, for the most part, started to become accustomed to this ‘higher for longer’ narratives,” he said.
While volume rose slightly in September, supply year-to-date is still down 12.9% from 2022.
This is unsurprising for many, said Gastall and fellow Morgan Stanley investment strategist Daryl Helsing.
“Despite hovering near 30-year averages in the belly and long-end of the yield curve, higher interest rates have increased the cost-of-capital for many state and local government borrowings,” they said.
Now that fall is here, they said “many public borrowing initiatives need to be underwritten and/or refinanced, while a number of municipalities are now looking to capture investor attention in the event interest rates continue to rise during the fourth quarter.”
They believe there will be an influx of supply this fall. The new-issue calendar for the first week of October is estimated at $8.556 billion, according to Ipreo and The Bond Buyer.
The upcoming new-issue calendar boasts several large deals.
This includes $1.04 billion of senior airport revenue bonds from the San Diego County Regional Airport, $965 million of GOs from New York City and $823 million of restructuring bonds from the Utility Debt Securitization Authority in the negotiated calendar, along with $942 million of taxable various purpose GOs from California in two deals on the competitive calendar.
As volume picks up in October, Luby believes market conditions will continue to be weak.
“There’s going to be some interesting opportunities for investors to pick up higher yields and wider spreads,” he said. “If they’ve been waiting for something specific in the new-issue calendar, there’ll be some good buys in here.”
Issuance details
Revenue bond issuance increased 29.9% to $17.402 billion from $13.392 billion in September 2022, and general obligation bond sales fell 26.5% to $10.183 billion from $13.859 billion in 2022.
Negotiated deal volume was up 25.6% to $22.785 billion from $18.139 billion a year prior. Competitive sales decreased 38.4% to $4.349 billion from $7.057 billion in 2022.
Deals wrapped by bond insurance were at $2.623 billion in 126 deals from $1.242 billion in 94 deals in 2022, a 111.1% increase.
Bank-qualified issuance rose 1.4% to $624.4 million in 162 deals from $615.6 million in 173 deals a year prior.

In the states, Texas claimed the top spot year-to-date.
Issuers in the Lone Star State accounted for $49.350 billion, up 20.2% year-over-year. California was second with $39.940 billion, up 4.4%. New York was third with $28.400 billion, down 31.1%, followed by Illinois in fourth with $8.827 billion, down 18.5%, and Florida in fifth with $8.748 billion, a 36.3% decrease from 2022.
Rounding out the top 10: Georgia with $8.429 billion, up 5%; Michigan with $7.642 billion, down 7.5%; Washington with $7.631 billion, down 5.2%; Wisconsin at $6.642 billion, down 6.7%; and Pennsylvania with $6.190 billion, down 26.5%.